Oscillations - Result Question 6
7. The oscillation of a body on a smooth horizontal surface is represented by the equation,
$ X=A \cos (\omega t) $
where $X=$ displacement at time $t$
$\omega=$ frequency of oscillation
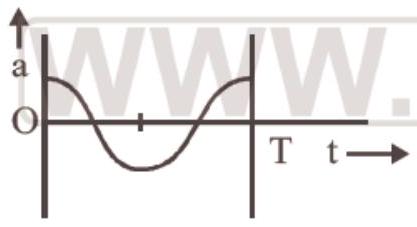
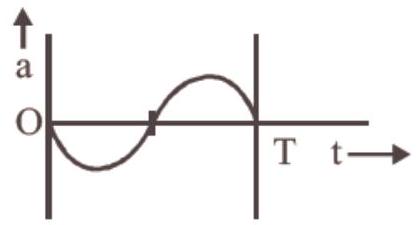
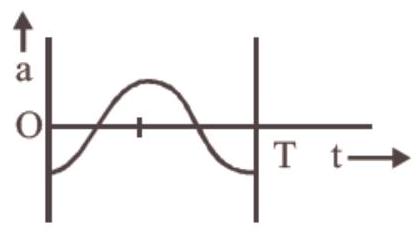
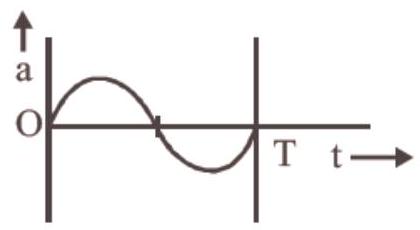
Which one of the following graphs shows correctly the variation of ’ $a$ ’ with ’ $t$ ‘?
(a)
(b)
(c)
(d)
Show Answer
Answer:
Correct Answer: 7. (c)
Solution:
- (c) Displacement, $x=A \cos (\omega t)($ given $)$
Velocity, $v=\frac{dx}{dt}=-A \omega \sin (\omega t)$
Acceleration, $a=\frac{dv}{dt}=-A \omega^{2} \cos \omega t$
Hence graph (c) correctly dipicts the variation of a with $t$.
(d) As $\frac{v^{2}}{a^{2} \omega^{2}}+\frac{y^{2}}{a^{2}}=1$ This is the equation of ellipse. Hence the graph is an ellipse. $P$ versus $x$ graph is similar to $v$ versus $x$ graph.
(b) $y=3 \sin \frac{\pi}{2}(50 t-x)$
$y=3 \sin (25 \pi t-\frac{\pi}{2} x)$ on comparing with the standard wave equation
$y=a \sin (\omega t-k x)$
Wave velocity $v=\frac{\omega}{k}=\frac{25 \pi}{\pi / 2}=50 m / sec$.
The velocity of particle
$v_p=\frac{\partial y}{\partial t}=75 \pi \cos (25 \pi t-\frac{\pi}{2} x)$
$v _{p \max }=75 \pi$
then $\frac{v _{p _{\max }}}{v}=\frac{75 \pi}{50}=\frac{3 \pi}{2}$


