Statistics and Probability
Multiple Choice Questions(MCQs)
Write the correct answer in each of the following:
1. The class mark of the class $90-120$ is:
(A) 90
(B) 105
(C) 115
(D) 120
Show Answer
Solution
According to the question,
Upper limit $=120$ and lower limit $=90$,
Now, the class mark will be calculated as follows:
Class mark $=\dfrac{\text{ Upper class }+ \text{ Lower class }}{2}$
$ \begin{aligned} & =\dfrac{120+90}{2} \\ & =\dfrac{210}{2} \\ & =105 \end{aligned} $
Hence, the correct option is (B).
2. The range of the data:
$25,18,20,22,16,6,17,15,12,30,32,10,19,8,11,20$ is
(A) 10
(B) 15
(C) 18
(D) 26
Show Answer
Solution
Consider the data set:
$25,18,20,22,16,6,17,15,12,30,32,10,19,8,11,20$
Now, in the given data:
Minimum value of data set $=6$
Maximum value of data set $=32$
As, Range $=$ Maximum value of data set - Minimum value of data set
Range $=32-6$
Range $=26$
Hence, the correct option is (D).
3. In a frequency distribution, the mid value of a class is 10 and the width of the class is 6 . The lower limit of the class is:
(A) 6
(B) 7
(C) 8
(D) 12
Show Answer
Solution
Given: Mid-value $=10$
Range $=6$
Let upper class and lower class of the interval are $x$ and $y$ respectively.
Now,
Mid-value $=\dfrac{\text{ Upper class }+ \text{ Lower class }}{2}$
$ 10=\dfrac{x+y}{2} $
$$ \begin{equation*} x+y=20 \tag{I} \end{equation*} $$
As, Range $=$ Maximum value of data set - Minimum value of data set
$6=x-y$
$x-y=6$
Adding equation (I) and (II), get:
$x+y+(x-y)+20+6$
$2 x=26$
$x=\dfrac{26}{2}$
$x=13$
Putting the value of $x$ in equation (I), get:
$13+y=20$
$y=20-13$
$y=7$
Hence, the correct option is (B).
4. The width of each of five continuous classes in a frequency distribution is 5 and the lower class-limit of the lowest class is 10 . The upper class-limit of the highest class is:
(A) 15
(B) 25
(C) 35
(D) 40
Show Answer
Solution
Given: Lower class limit $=10$
Width $=5$
As, we know that, width $=$ Upper class limit - Lower class limit
So, Upper class limit $=10+5$
Upper class limit $=15$
Since, the five continuous classes are:
$10-15,15-20,20-25,25-30$, and 30-35
Therefore, the upper class limit of the highest class is 35 .
Hence, the correct option is (C).
5. Let $m$ be the mid-point and $l$ be the upper class limit of a class in a continuous frequency distribution. The lower class limit of the class is :
(A) $2 m+l$
(B) $2 m-l$
(C) $m-l$
(D) $m-2 l$
Show Answer
Solution
Given:
Mid-point $=m$
Upper class limit $=1$
As, we know that, mid-point $=\dfrac{\text{ Upper class limit }+ \text{ Lower class limit }}{2}$
So,
$m=\dfrac{l+\text{ Lower class limit }}{2}$
$l+$ Lower class limit $=2 m$
Lower class limit $=2 m-l$
Hence, the correct option is (B).
6. The class marks of a frequency distribution are given as follows: $15,20,25, \ldots$
The class corresponding to the class mark 20 is:
(A) 12.5 - 17.5
(B) $17.5-22.5$
(C) $18.5-21.5$
(D) $19.5-20.5$
Show Answer
Solution
Given: the class marks are: $15,20,25 \ldots$
The size of the each class interval is: $25-20=20-15=5$
Therefore, the class interval corresponding to the class mark 20 is:
$20-2.5-(20+2.5)$ that is $17.5-22.5$
Hence, the correct option is (B).
7. In the class intervals $10-20,20-30$, the number 20 is included in:
(A) 10-20
(B) 20-30
(C) Both the intervals
(D) None of these intervals
Show Answer
Solution
In the class intervals $10-20,20-30$, the number 20 is included in $20-30$.
Hence, the correct option is (B).
8. A grouped frequency table with class intervals of equal sizes using 250270 (270 not included in this interval) as one of the class interval is constructed for the following data:
268, 220, 368, 258, 242, 310, 272, 342,
$310,290,300,320,319,304,402,318$,
$406,292,354,278,210,240,330,316$,
$406,215,258,236$.
The frequency of the class $310-330$ is:
(A) 4
(B) 5
(C) 6
(D) 7
Show Answer
Solution
Given data set is,
$268,220,368,258,242,310,272,342$,
$310,290,300,320,319,304,402,318$,
$406,292,354,278,210,240,330,316$,
$406,215,258,236$
The observation corresponding to class $310-330$ are class $310,310,320,319,318,316$ that is 6 observations.
So, the frequency of the class $310-330$ is 6 .
Hence, the correct option is (B).
9. A grouped frequency distribution table with classes of equal sizes using 63-72
(72 included) as one of the class is constructed for the following data:
$30,32,45,54,74,78,108,112,66,76,88$, $40,14,20,15,35,44,66,75,84,95,96$,
$102,110,88,74,112,14,34,44$.
The number of classes in the distribution will be:
(A) 9
(B) 10
(C) 11
(D) 12
Show Answer
Solution
Consider the data set:
$30,32,45,54,74,78,108,112,66,76,88$,
$40,14,20,15,35,44,66,75,84,95,96$,
$102,110,88,74,112,14,34,44$.
So, in the above given data set:
Minimum value $=14$
Maximum value $=112$
Since, the class are:
$13-22,23,32,33-42,43-52,53-62,63-72,73-82,83-92,93-102$ and $103-112$.
Since, the number of class in the distribution is 10 .
10. To draw a histogram to represent the following frequency distribution:
$\begin{array}{|l|l|l|l|l|l|} \hline \text{Class Interval} & 5-10 & 10-15 & 15-25 & 25-45 & 45-75 \\ \hline \text{Freequency} & 6 & 12 & 10 & 8 & 15 \\ \hline \end{array}$
the adjusted frequency for the class $25-45$ is :
(A) 6
(B) 5
(C) 3
(D) 2
Show Answer
Solution
The adjusted frequency for the class $25-45$ will be:
$=\dfrac{\text{ Frequency of the class }}{\text{ Class width }} \times$ Minimum width
$=\dfrac{8}{20} \times 5$
$=2$
Hence, the correct option is (D).
11. The mean of five numbers is 30 . If one number is excluded, their mean becomes 28 . The excluded number is:
(A) 28
(B) 30
(C) 35
(D) 38
Show Answer
Solution
Given: The mean of five numbers is 30 .
Mean $=28$
Sum of the five numbers $=30 \times 5=150$
Suppose that the excluded number be $a$. So,
Sum of four data point $=150-a$
The formula of the mean is: Mean $=\dfrac{\text{ Sum of all data points }}{\text{ Number of data points }}$
Now,
$ \begin{aligned} 28 & =\dfrac{150-a}{4} \\ 150-a & =28 \times 4 \\ 150-a & =112 \\ a & =150-112 \\ a & =38 \end{aligned} $
Hence, the correct option is (D).
12. If the mean of the observations:
$x, x+3, x+5, x+7, x+10$
is 9 , the mean of the last three observations is
(A) $10 \dfrac{1}{3}$
(B) $10 \dfrac{2}{3}$
(C) $11 \dfrac{1}{3}$
(D) $11 \dfrac{2}{3}$
Show Answer
Solution
Consider the data set:
$x, x+3, x+5, x+7, x+10$
Mean $=9$
The formula of the mean is: Mean $=\dfrac{\text{ Sum of all data points }}{\text{ Number of data points }}$
$ \begin{aligned} 9 & =\dfrac{x+x+3+x+5+x+7+x+10}{5} \\ 5 x+25 & =45 \\ 5 x & =45-25 \\ 5 x & =20 \\ x & =4 \end{aligned} $
So, last three observation at $x=4$ are: $4+5=9,4+7=11$, and $4+10=14$.
Now, the mean of last three observation is:
Mean $=\dfrac{9+11+14}{3}$
$ \begin{aligned} & =\dfrac{34}{3} \\ & =11 \dfrac{1}{3} \end{aligned} $
Hence, the correct option is (C).
13. If $\bar{{}x}$ represents the mean of $n$ observations $x 1, x 2, \ldots, x n$, then value of $\sum _{i=1}^{n}(x_i-\bar{{}x})$ is:
(A) -1
(B) 0
(C) 1
(D) $n-1$
Show Answer
Solution
The formula of the mean $(\bar{{}x})$ is:
$\bar{{}x}=\dfrac{\sum _{i=1}^{n} x_i}{n}$
$\sum _{i=1}^{n} x_i=n \bar{{}x}$
Here, $n$ is total number of observation.
The value of $\sum _{i=1}^{n}(x_i-\bar{{}x})$ is calculated as follows:
$\sum _{i=1}^{n}(x_i-\bar{{}x})=\sum _{i=1}^{n} x_i-\sum _{i=1}^{n} \bar{{}x}$
Now, from equation (I), get:
$ \begin{aligned} \sum _{i=1}^{n}(x_i-\bar{{}x}) & =n \bar{{}x}-\sum _{i=1}^{n} \bar{{}x} \\ & =n \bar{{}x}-\bar{{}x} \sum _{i=1}^{n} 1 \\ & =n \bar{{}x}-n \bar{{}x} \\ & =0 \end{aligned} $
Hence, the correct option is (B).
14. If each observation of the data is increased by 5 , then their mean
(A) remains the same
(B) becomes 5 times the original mean
(C) is decreased by 5
(D) is increased by 5
Show Answer
Solution
The formula of the mean $(\bar{{}x})$ is:
$\bar{{}x}=\dfrac{\sum _{i=1}^{n} x_i}{n}$
Now, according to the question: let new mean is $\bar{x} _{\text{New }}$.
$ \begin{aligned} \bar{x} _{New} & =\dfrac{(x_1+5)+(x_2+5)+\ldots+(x_n+5)}{n} \\ & =\dfrac{x_1+x_2+\ldots+x_n+5 n}{n} \\ & =\dfrac{x_1+x_2+\ldots+x_n}{n}+\dfrac{5 n}{n} \\ \bar{x} _{New} & =\bar{{}x}+5 \end{aligned} $
Therefore, the new mean is increased by 5 .
Hence, the correct option is (D).
15. Let $x$ be the mean of $x 1, x 2, \ldots, x n$ and $y$ the mean of $y 1, y 2, \ldots, y n$. If $\bar{{}z}$ is the mean of $x 1, x 2, \ldots, x n, y 1, y 2, \ldots, y n$, then $\bar{{}z}$ is equal to
(A) $\bar{{}x}+\bar{{}y}$
(B) $\dfrac{\bar{{}x}+\bar{{}y}}{2}$
(C) $\dfrac{\bar{{}x}+\bar{{}y}}{n}$
(D) $\dfrac{\bar{{}x}+\bar{{}y}}{2 n}$
Show Answer
Solution
The formula of the mean $(\bar{{}x})$ is:
$\bar{{}x}=\dfrac{\sum _{i=1}^{n} x_i}{n}$
Now, according to the question:
$\bar{{}x}=\dfrac{x_1+x_2+\ldots+x_n}{n}$
And :
$\bar{{}y}=\dfrac{y_1+y_2+\ldots+y_n}{n}$
Then,
$\bar{{}z}=\dfrac{x_1+x_2+\ldots+x_n+y_1+y_2+\ldots+y_n}{2 n}$ $\bar{{}z}=\dfrac{1}{2}(\dfrac{x_1+x_2+\ldots+x_n}{n}+\dfrac{y_1+y_2+\ldots+y_n}{n})$
Now, by equations (I) and (II):
$\bar{{}z}=\dfrac{\bar{{}x}+\bar{{}y}}{2 n}$
Hence, the correct option is (D).
16. If $\bar{{}x}$ is the mean of $x 1, x 2, \ldots, x n$, then for $a \neq 0$, the mean of $a x_1, a x_2, \ldots a x_n, \dfrac{x_1}{a}, \dfrac{x_2}{a}, \ldots, \dfrac{x_n}{a}$ is
(A) $(a+\dfrac{1}{a}) \bar{{}x}$
(B) $(a+\dfrac{1}{a}) \dfrac{\bar{{}x}}{2}$
(C) $(a+\dfrac{1}{a}) \dfrac{\bar{{}x}}{n}$
(D) $\dfrac{(a+\dfrac{1}{a}) \bar{{}x}}{2 n}$
Show Answer
Solution
Given: $\bar{{}x}$ is the mean of $x 1, x 2, \ldots, x n$.
Then,
$\bar{{}x}=\dfrac{x_1+x_2+\ldots+x_n}{n}$
Let the mean of the data set $a x_1, a x_2, \ldots a x_n, \dfrac{x_1}{a}, \dfrac{x_2}{a}, \ldots, \dfrac{x_n}{a}$ is $\bar{{}y}$. So,
$\bar{{}y}=\dfrac{a x_1+a x_2+\ldots+a x_n+\dfrac{x_1}{a}+\dfrac{x_2}{a}+\ldots+\dfrac{x_n}{a}}{2 n}$
$\bar{{}y}=\dfrac{a(x_1+x_2+\ldots+x_n)+\dfrac{1}{a}(x_1+x_2+\ldots+x_n)}{2 n}$
$\bar{{}y}=\dfrac{(a+\dfrac{1}{a})(x_1+x_2+\ldots+x_n)}{2 n}$
From equation (I):
$\bar{{}y}=\dfrac{(a+\dfrac{1}{a}) \bar{{}x}}{2}$
Hence, the correct option is (B).
17. If $\overline{x_1}, \overline{x_2}, \overline{x_3}, \ldots, \overline{x_n}$ are the means of $\boldsymbol{{}n}$ groups with $n_1, n_2, \ldots, n_i$ number of observations respectively, then the mean $x$ of all the groups taken together is given by:
(A) $\sum _{i=1}^{n} n_i \overline{x_i}$
(B) $\dfrac{\sum _{i=1}^{n} n_i \overline{x_i}}{n^{2}}$
(C) $\dfrac{\sum _{i=1}^{n} n_i \bar{x}_i}{\sum _{i=1}^{n} n_i}$
(D) $\dfrac{\sum _{i=1}^{n} n_i \bar{x}_i}{2 n}$
Show Answer
Solution
The formula of the mean $(\bar{{}x})$ is:
$\bar{{}x}=\dfrac{\sum _{i=1}^{n} x_i}{n}$
Now, according to the question:
Short Answer Questions with Reasoning
1. The frequency distribution:
$\begin{array}{|l|l|l|l|l|} \hline \text{Marks} & 0-20 & 20-40 & 40-60 & 60-100 \\ \hline \text{Number of students} & 10 & 15 & 20 & 25 \\ \hline \end{array}$
has been represented graphically as follows:
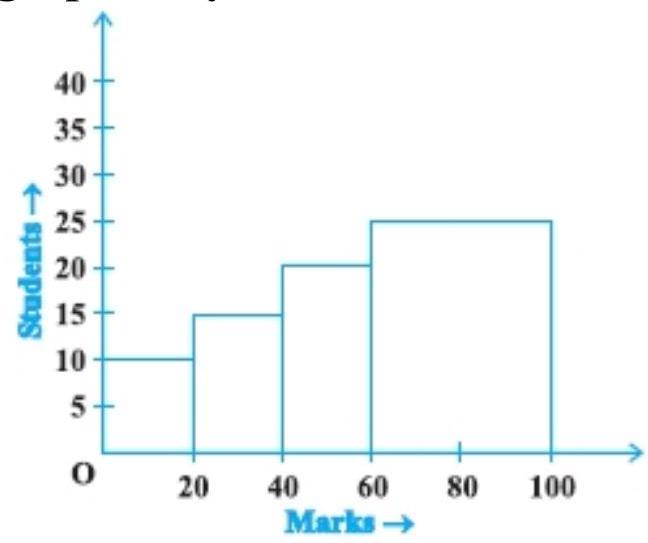
Do you think this representation is correct? Why?
Show Answer
Solution
The class of the frequency distribution table is not uniform width.
Hence, this representation is not correct.
2. In a diagnostic test in mathematics given to students, the following marks (out of 100) are recorded:
$46,52,48,11,41,62,54,53,96,40,98,44$
Which ‘average’ will be a good representative of the above data and why?
Show Answer
Solution
Consider the data set:
$46,52,48,11,41,62,54,53,96,40,98,44$
Median will be a good representative of the given data. Because:
- Each value occurs once.
- The data is influenced by extreme values.
- A child says that the median of $3,14,18,20,5$ is 18 . What doesn’t the child understand about finding the median?
Show Answer
Solution
When we have to find out the median of the data set, then first we have to arrange them in ascending order or descending order.
4. A football player scored the following number of goals in the 10 matches: $1,3,2,5,8,6,1,4,7,9$
Since the number of matches is 10 (an even number), therefore, the median
$=\dfrac{5^{\text{th }} \text{ observation }+6^{\text{th }} \text{ observation }}{2}$
$=\dfrac{8+6}{2}=7$
Is it the correct answer and why?
Show Answer
Solution
The calculated answer is not correct.
Before finding the median, first, data have to arrange in ascending or descending order.
5. Is it correct to say that in a histogram, the area of each rectangle is proportional to the class size of the corresponding class interval? If not, correct the statement.
Show Answer
Solution
As we know that in a histogram, the area of each rectangle is proportional to the corresponding frequency of its class.
Hence, the given statement is not correct.
6. The class marks of a continuous distribution are:
$1.04,1.14,1.24,1.34,1.44,1.54$ and 1.64
Is it correct to say that the last interval will be 1.55 - 1.73? Justify your answer.
Show Answer
Solution
The difference between two consecutive class marks should be equal to the class size. Since, difference between two consecutive marks is 0.1 and class size of $1.55-1.73$ is 0.18 , which are not equal.
Hence, the given statement is not correct.
7. 30 children were asked about the number of hours they watched TV programmes last week. The results are recorded as under:
$\begin{array}{|l|l|l|l|l|} \hline \text{Number of hours} & 0-5 & 5-10 & 10-15 & 15-20 \\ \hline \text{Frequency} & 8 & 16 & 4 & 2 \\ \hline \end{array}$
Can we say that the number of children who watched TV for 10 or more hours a week is 22 ? Justify your answer.
Show Answer
Solution
The number of children who watched TV for 10 or more hour in week is $=4+2$ that is 6 .
Hence, the given statement is false.
8. Can the experimental probability of an event be a negative number? If not, why?
Show Answer
Solution
The number of trials in which the event can happen cannot be negative and the total number of trials is always positive.
Hence, the given statement is false.
9. Can the experimental probability of an event be greater than 1? Justify your answer.
Show Answer
Solution
The number of trials in which the event can happen cannot be greater than the total number of trials.
Hence, the given statement is false.
10. As the number of tosses of a coin increases, the ratio of the number of heads to the total number of tosses will be $\dfrac{1}{2}$. Is it correct? If not, write the correct one.
Show Answer
Solution
The number of coin increases, the ratio of the number of heads to the total number of tosses will be nearer to $\dfrac{1}{2}$ but not exactly $\dfrac{1}{2}$.
Hence, the given statement is false.
Short Answer Questions
1. The blood groups of 30 students are recorded as follows:
$\mathbf{A}, \mathbf{B}, \mathbf{O}, \mathbf{A}, \mathbf{A B}, \mathbf{O}, \mathbf{A}, \mathbf{O}, \mathbf{B}, \mathbf{A}, \mathbf{O}, \mathbf{B}, \mathbf{A}, \mathbf{A B}, \mathbf{B}, \mathbf{A}, \mathbf{A B}, \mathbf{B}$,
$\mathbf{A}, \mathbf{A}, \mathbf{O}, \mathbf{A}, \mathbf{A B}, \mathbf{B}, \mathbf{A}, \mathbf{O}, \mathbf{B}, \mathbf{A}, \mathbf{B}, \mathbf{A}$
Prepare a frequency distribution table for the data.
Show Answer
Solution
A frequency distribution table for the given data is given below:
| Blood group | Number of students (Frequency) |
|---|---|
| $A$ | 12 |
| $B$ | 8 |
| $AB$ | 4 |
| O | 6 |
| Total | 30 |
2. The value of $\pi$ upto 34 decimal places is given below:
3.14159265358979323846264338327950288
Make a frequency distribution of the digits 0 to 9 after the decimal point.
Show Answer
Solution
A frequency distribution table for the given data is given below:
| Digit | Frequency |
|---|---|
| 0 | 1 |
| 1 | 1 |
| 2 | 5 |
| 3 | 6 |
| 4 | 3 |
| 5 | 4 |
| 6 | 3 |
| 7 | 2 |
| 8 | 5 |
| 9 | 4 |
3. The scores (out of 100) obtained by 33 students in a mathematics test are as follows:
$69,48,84,58,48,73,83,48,66,58,84$
$66,64,71,64,66,69,66,83,66,69,71$
$81,71,73,69,66,66,64,58,64,69,69$
Represent this data in the form of a frequency distribution.
Show Answer
Solution
A frequency distribution table for the given data is given below:
| Scores | Frequency |
|---|---|
| 48 | 3 |
| 58 | 3 |
| 64 | 4 |
| 66 | 7 |
| 69 | 6 |
| 71 | 3 |
| 73 | 2 |
| 81 | 1 |
| 83 | 2 |
| 84 | 2 |
| Total | 33 |
4. Prepare a continuous grouped frequency distribution from the following data:
| Mid-point | Frequency |
|---|---|
| 5 | 4 |
| 15 | 8 |
| 25 | 13 |
| 35 | 12 |
| 45 | 6 |
Also find the size of class intervals.
Show Answer
Solution
The common difference of mid-point $=15-5=10$.
Let lower limit is a. So, upper limit will be $=a+10$
As we know that:
Mid value $=\dfrac{\text{ Lower limit }+ \text{ Upper limit }}{2}$
$ \begin{aligned} 5 & =\dfrac{a+a+10}{2} \\ 2 a+10 & =10 \\ 2 a & =10-10 \\ a & =0 \end{aligned} $
Therefore, the first interval is $0-10$.
Now, a frequency distribution table for the given data is given below:
| Mid-point | Class interval | Frequency |
|---|---|---|
| 5 | $0-10$ | 4 |
| 15 | $10-20$ | 8 |
| 25 | $20-30$ | 13 |
| 35 | $30-40$ | 12 |
| 45 | $40-50$ | 6 |
5. Convert the given frequency distribution into a continuous grouped frequency distribution:
| Class interval | Frequency |
|---|---|
| $150-153$ | 7 |
| $154-157$ | 7 |
| $158-161$ | 15 |
| $162-165$ | 10 |
| $166-169$ | 5 |
| $170-173$ | 6 |
In which intervals would 153.5 and 157.5 be included?
Show Answer
Solution
See the given table in the question:
Upper limit of class interval $150-153$ is 153 . And lower limit of class interval 154-157 is 154. Now, difference between upper and lower limit will be $=154-153=1$
So, half of the difference $=0.5$
Therefore, we have to subtracted 0.5 from each lower limit and add 0.5 to each upper limit. Hence, the table for continuous grouped frequency distribution is given below:
| Class interval | Frequency |
|---|---|
| $149.5-153.5$ | 7 |
| $153.5-157.5$ | 7 |
| $157.5-161.5$ | 15 |
| $161.5-165.5$ | 10 |
| $165.5-169.5$ | 5 |
| $169.5-173.5$ | 6 |
Thus, 153.5 and 157.5 would use in the class intervals $153.5-157.5$ and 157.5-161.5, respectively.
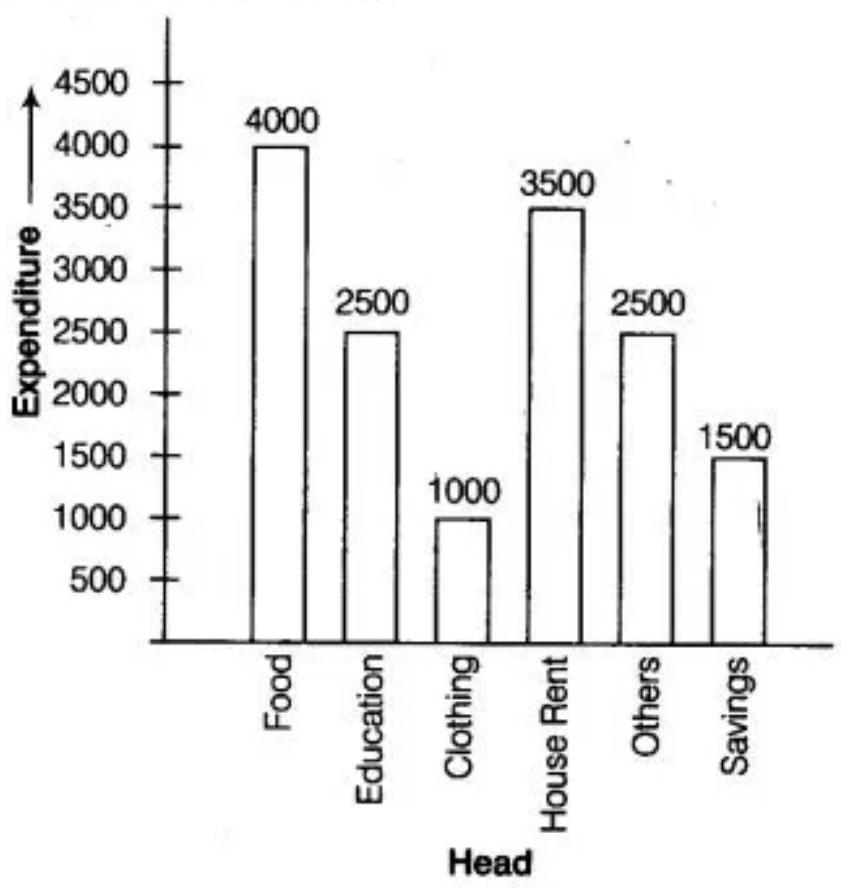
6. The expenditure of a family on different heads in a month is given below:
$\begin{array}{|l|l|l|l|l|l|l|} \hline \text{Head} & \text{Food} & \text{Education} & \text{Clothing} & \text{House Rent} & \text{Others} & \text{Savings} \\ \hline \text{Expenditure Rs} & 4000 & 2500 & 1000 & 3500 & 2500 & 1500 \\ \hline \end{array}$
Draw a bar graph to represent the data above.
Show Answer
Solution
We represent the head variable on the $x$-axis and expenditure on the $y$-axis.
Let choose the scale as 1 unit $=$ Rs. 500
To represent our first head that is,food, we draw a rectangular bar with width 1 unit and height 8 units.
Similarly, other heads are represented by leaving a gap of $\dfrac{1}{2}$ unit in between two consecutive bars.
The bar graph for given data is shown below:
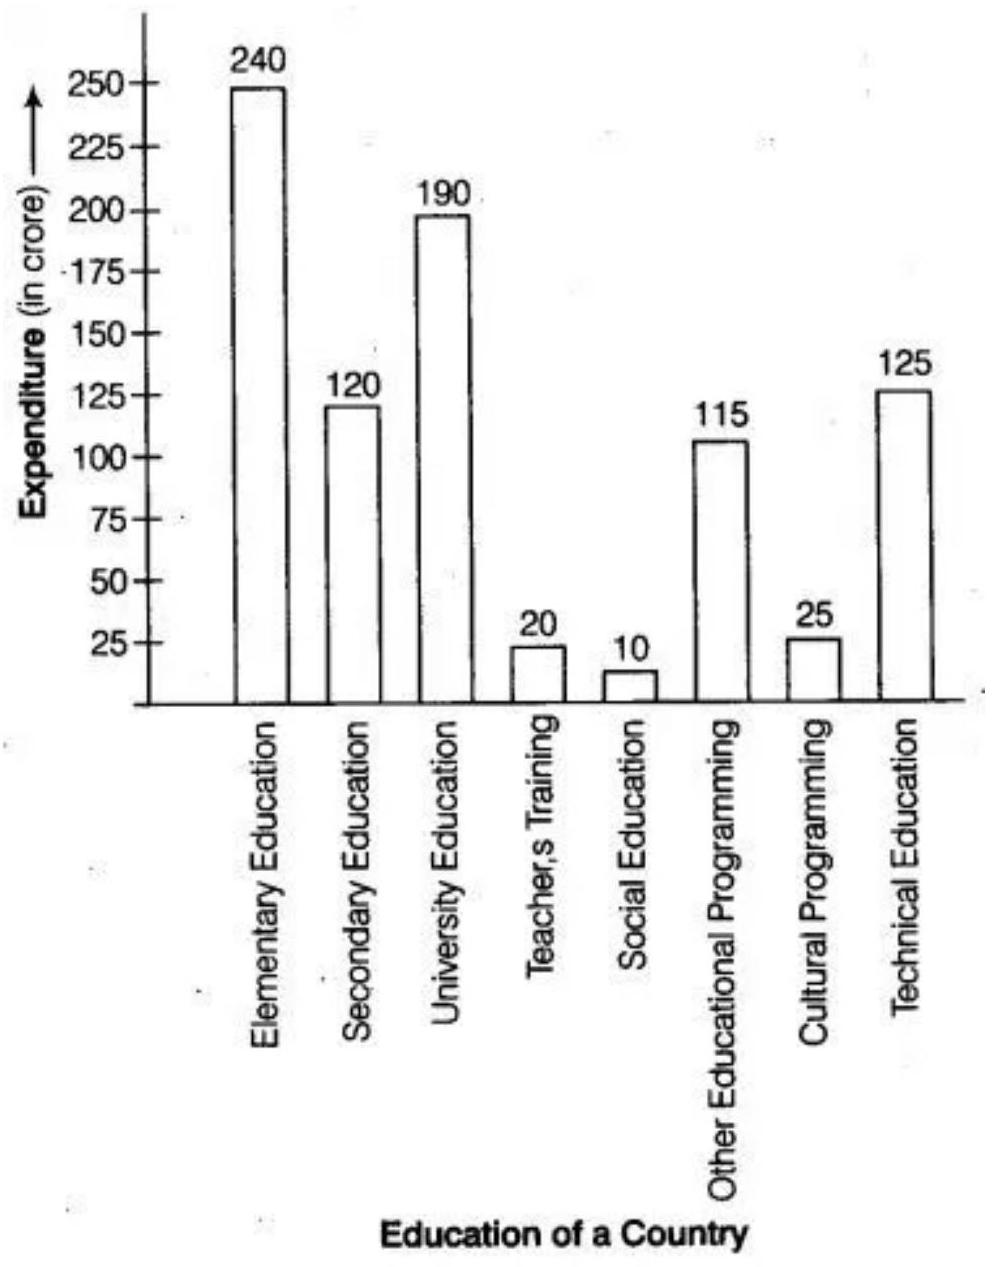
7. Expenditure on Education of a country during a five year period (20022006), in crores of rupees, is given below:
| Elementary education | $\mathbf{2 4 0}$ |
|---|---|
| Secondary education | 120 |
| University education | 190 |
| Teacher’s training | 2 0 |
| Social education | 10 |
| Other educational programmes | 115 |
| Cultural programmes | 25 |
| Technical education | 125 |
Represent the information above by a bar graph.
Show Answer
Solution
We represent the education of a country as a variable on the $x$-axis and expenditure on the $y$ axis.
The maximum expenditure is Rs. 240 crore. So, we can choose the scale as 1 unit $=$ Rs. 25 crore.
To represent our first education of a country that is, elementary education, we draw a rectangular bar with width 1 unit and height 9.6 units.
Similarly, other heads are represented by leaving gap of $\dfrac{1}{2}$ unit in between two consecutive bars.
The bar graph for given data is shown below:
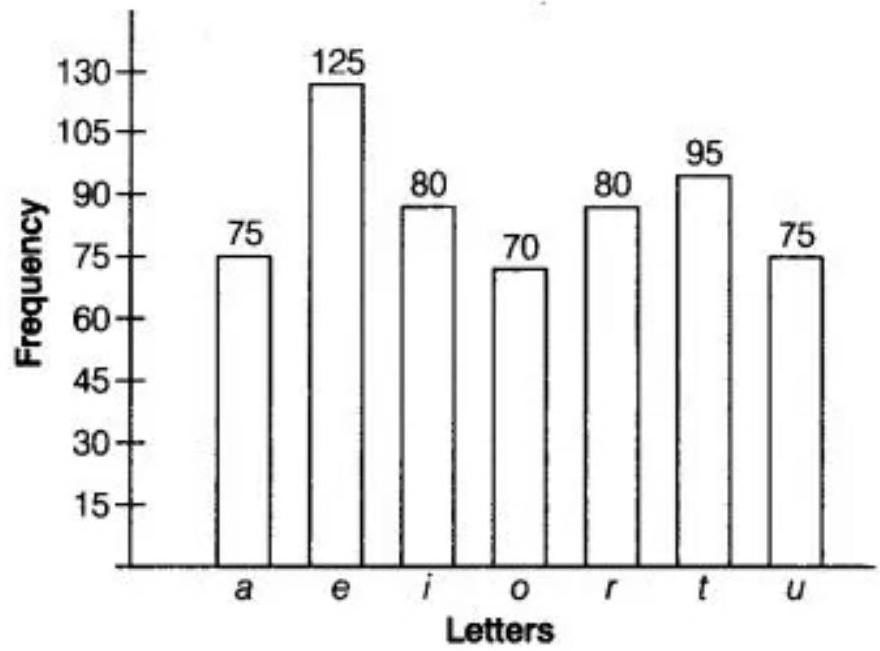
8. The following table gives the frequency of most commonly used letters $a$, $e, i, o, r, t, u$ from a page of a book:
$\begin{array}{|l|l|l|l|l|l|l|l|} \hline \text{Letters} & a & e & i & o & r & t & u \\ \hline \text{Frequency} & 75 & 125 & 80 & 70 & 80 & 95 & 75 \\ \hline \end{array}$
Represent the information above by a bar graph.
Show Answer
Solution
We represent the letter as a variable on the $x$-axis and frequency on the $y$-axis.
According to the given table, we can choose the scale as 1 unit $=15$ frequency.
To represent our first letter that is, a, we draw a rectangular bar with width 1 unit and height 5 units.
Similarly, other heads are represented by leaving a gap of $\dfrac{1}{2}$ unit in between two consecutive bars.
The bar graph for given data is shown below
9. If the mean of the following data is 20.2 , find the value of $p$ :
$\begin{array}{|l|l|l|l|l|l|} \hline x & 10 & 15 & 20 & 25 & 30 \\ \hline f & 6 & 8 & p & 10 & 6 \\ \hline \end{array}$
Show Answer
Solution
Consider the data:
$\begin{array}{|l|l|l|l|l|l|} \hline x & 10 & 15 & 20 & 25 & 30 \\ \hline f & 6 & 8 & p & 10 & 6 \\ \hline \end{array}$
| $x_i$ | $f_i$ | $x_if_i$ |
|---|---|---|
| 10 | 6 | 60 |
| 15 | 8 | 120 |
| 20 | p | 20p |
| 25 | 10 | 250 |
| 30 | 6 | 180 |
| Total | 30+p | 610+20p |
As we know that:
Mean of the data $(\bar{{}x})=\dfrac{\sum _{i=1}^{n} f_i x_i}{\sum _{i=1}^{n} f_i}$
So,
$ \begin{aligned} 20.2 & =\dfrac{f_1 x_1+f_2 x_2+f_3 x_3+f_4 x_4+f_5 x_5}{f_1+f_2+f_3+f_4+f_5} \\ 20.2 & =\dfrac{6 \times 10+8 \times 15+p \times 20+10 \times 25+6 \times 30}{6+8+p+10+6} \\ 20.2 & =\dfrac{60+120+20 p+250+180}{30+p} \\ 20 p+610 & =606+20.2 p \\ 610-606 & =0.2 p \\ \dfrac{2 p}{10} & =4 \\ p & =10 \times 2 \\ p & =20 \end{aligned} $
Therefore, the value of $p$ is 20 .
10. Obtain the mean of the following distribution:
| Frequency | Variable |
|---|---|
| 4 | 4 |
| 8 | 6 |
| 14 | 8 |
| 11 | 10 |
| 3 | 12 |
Show Answer
Solution
| $x_i$ | $f_i$ | $x_if_i$ |
|---|---|---|
| 4 | 4 | 16 |
| 6 | 8 | 48 |
| 8 | 14 | 112 |
| 10 | 11 | 110 |
| 12 | 3 | 36 |
| Total | 40 | 322 |
As we know that:
Mean of the data $(\bar{{}x})=\dfrac{\sum _{i=1}^{n} f_i x_i}{\sum _{i=1}^{n} f_i}$
So,
$=\dfrac{4 \times 4+8 \times 6+14 \times 8+11 \times 10+3 \times 12}{4+8+14+11+3}$
$=\dfrac{16+48+112+110+36}{40}$
$=\dfrac{322}{40}$
$=8.05$
Hence, the mean of the given data set is 8.05 .
11. A class consists of 50 students out of which 30 are girls. The mean of marks scored by girls in a test is 73 (out of 100) and that of boys is 71. Determine the mean score of the whole class.
Show Answer
Solution
Given: In a class consists of 50 students out of which 30 are girls.
So, number of boys in the class $=50-30=20$
Now, the marks obtained by 30 girls $=30 \times 73=2190$
And the marks obtained by 20 boys $=20 \times 71=1420$
Then, mean score of the whole class will be calculated as follows:
Mean $=\dfrac{\text{ Marks obtained by } 30 \text{ girls }+ \text{ Marks obtained by } 20 \text{ girls }}{\text{ Number of girls }+ \text{ Number of boys }}$
$ \begin{aligned} & =\dfrac{2190+1420}{50} \\ & =\dfrac{3610}{50} \\ & =72.2 \end{aligned} $
Hence, mean of the whole class is 72.2 .
12. Mean of 50 observations was found to be 80.4. But later on, it was discovered that 96 was misread as 69 at one place. Find the correct mean.
Show Answer
Solution
Given, the mean of 50 observations $=80.4$
The formula of the mean $(\bar{{}x})$ is:
$\bar{{}x}=\dfrac{\sum _{i=1}^{n} x_i}{n}$
So, sum of 50 observations $=80.4 \times 50=4020$
Now, according to the question, 96 was misread as 69 at one place.
Therefore, the correct mean will be $=\dfrac{\text{ (Sum of } 50 \text{ observations })-69+96}{50}$
$ \begin{aligned} & =\dfrac{4020-69+96}{50} \\ & =\dfrac{4047}{50} \\ & =80.94 \end{aligned} $
Hence, the correct mean is 80.94 .
13. Ten observations $6,14,15,17, x+1,2 x-13,30,32,34,43$ are written in an ascending order. The median of the data is 24 . Find the value of $x$.
Show Answer
Solution
Consider the data set:
$6,14,15,17, x+1,2 x-13,30,32,34,43$
Since, $n$ is even. So, median will be calculated as follows:
$ \begin{aligned} \text{ Median } & =\dfrac{(\dfrac{n}{2})^{\text{th }} \text{ observation }+(\dfrac{n}{2}+1)^{\text{th }} \text{ observation }}{2} \\ & =\dfrac{(\dfrac{10}{2})^{\text{th }} \text{ observation }+(\dfrac{10}{2}+1)^{\text{th }} \text{ observation }}{2} \\ & =\dfrac{(5)^{\text{th }} \text{ observation }+(6)^{\text{th }} \text{ observation }}{2} \\ 24 & =\dfrac{x+1+2 x-13}{2} \\ 3 x-12 & =48 \\ 3 x & =60 \\ x & =20 \end{aligned} $
Hence, the value of $x$ is 20 .
14. The points scored by a basketball team in a series of matches are as follows:
$17,2,7,27,25,5,14,18,10,24,48,10,8,7,10,28$
Find the median and mode for the data.
Show Answer
Solution
Consider the data set:
$17,2,7,27,25,5,14,18,10,24,48,10,8,7,10,28$
Let arrange the given points scored in ascending order, get:
$2,5,7,7,8,10,10,10,14,17,18,24,25,27,28,48$
Number of given observation in this data set is 16 that is even. So, median will be calculated as follows:
$ \begin{aligned} \text{ Median } & =\dfrac{(\dfrac{n}{2})^{\text{th }} \text{ observation }+(\dfrac{n}{2}+1)^{\text{th }} \text{ observation }}{2} \\ & =\dfrac{(\dfrac{16}{2})^{\text{th }} \text{ observation }+(\dfrac{16}{2}+1)^{\text{th }} \text{ observation }}{2} \\ & =\dfrac{(8)^{\text{th }} \text{ observation }+(9)^{\text{th }} \text{ observation }}{2} \\ & =\dfrac{10+14}{2} \\ & =\dfrac{24}{2} \\ & =12 \end{aligned} $
As we know that, mode is the observation which is repeated maximum number of times that is 10 .
Hence, median and mode for the given data are 12 and 10, respectively.
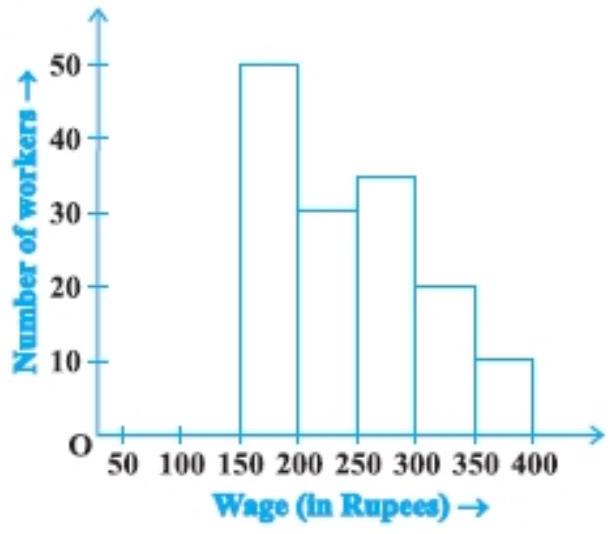
15. In Fig. 14.2, there is a histogram depicting daily wages of workers in a factory.
Construct the frequency distribution table.
Show Answer
Solution
See the above histogram that class interval start from 150-200, 200-250, having width. The frequency distribution table is given below:
| Wage (₹) | Number of workers |
|---|---|
| $150-200$ | 50 |
| $200-250$ | 30 |
| $250-300$ | 35 |
| $300-350$ | 20 |
| $350-400$ | 10 |
| Total | 145 |
16. A company selected 4000 households at random and surveyed them to find out a relationship between income level and the number of television sets in a home. The information so obtained is listed in the following table:
| Monthly income (in Rs.) |
Number of televisions/household | ||||
|---|---|---|---|---|---|
| 0 | 1 | 2 | Above 2 | ||
| $<\mathbf{1 0 0 0 0}$ | $\mathbf{2 0}$ | $\mathbf{8 0}$ | $\mathbf{1 0}$ | $\mathbf{0}$ | |
| $\mathbf{1 0 0 0 0 - 1 4 9 9 9}$ | $\mathbf{1 0}$ | $\mathbf{2 4 0}$ | $\mathbf{6 0}$ | $\mathbf{0}$ | |
| $\mathbf{1 5 0 0 0 - 1 9 9 9 9}$ | $\mathbf{0}$ | $\mathbf{3 8 0}$ | $\mathbf{1 2 0}$ | $\mathbf{3 0}$ | |
| $\mathbf{2 0 0 0 0 - 2 4 9 9 9}$ | $\mathbf{0}$ | $\mathbf{5 2 0}$ | $\mathbf{3 7 0}$ | $\mathbf{8 0}$ | |
| $\mathbf{2 5 0 0 0}$ and above | $\mathbf{0}$ | $\mathbf{1 1 0 0}$ | $\mathbf{7 6 0}$ | $\mathbf{2 2 0}$ |
Long Answer Questions
1. The following are the marks (out of 100) of 60 students in mathematics.
$16,13,5,80,86,7,51,48,24,56,70,19,61,17,16,36,34,42,34,35,72,55$, $75,31,52,28,72,97,74,45,62,68,86,35,85,36,81,75,55,26,95,31,7,78$, $92,62,52,56,15,63,25,36,54,44,47,27,72,17,4,30$.
Construct a grouped frequency distribution table with width 10 of each class starting from 0 - 9.
Show Answer
Solution
Arranging the given data in ascending order, get:
$4,5,7,7,13,15,16,16,17,17,19,24,25,26,27,28,30,31,31,34,34,35,35$,$36,36,36,42,44,45,47,48,51,52,52,54,55,55,56,56,61,62,62,63,68$,$70,72,72,72,74,75,75,78,80,81,85,86,86,92,95,97$
Now, arrange the given data set into class interval like $0-9,10-19, \ldots$ So, the class width in each case is 10 .
The frequency distribution of the given data is given below:
| Class interval | Tally marks | Frequency |
|---|---|---|
| $0-9$ | I | 1 |
| $10-19$ | ॥ | 2 |
| $20-29$ | IIII | 5 |
| $30-39$ | IIIII | 6 |
| $40-49$ | III | 3 |
| $50-59$ | IIII | 4 |
| $60-69$ | III | 3 |
| $70-79$ | II | 2 |
| $80-89$ | IIII | 5 |
| $90-99$ | IIII | 4 |
2. Refer to Q1 above. Construct a grouped frequency distribution table with width 10 of each class, in such a way that one of the classes is $10 - 20$ (20 not included).
Show Answer
Solution
Arrange the given data into class interval $0-10,10-20, \ldots$ The class width in each case is 10 .
The frequency distribution of the given data is given below:
| Class interval | Tally marks | Frequency |
|---|---|---|
| $0-10$ | IIII | 4 |
| $10-20$ | IIII II | 7 |
| $20-30$ | IIII | 5 |
| $30-40$ | IIII III | 10 |
| $40-50$ | IIII | 5 |
| $50-60$ | IIII III | 8 |
| $60-70$ | IIII | 5 |
| $70-80$ | II | 8 |
| $80-90$ | IIII | 5 |
| $90-100$ | III | 3 |
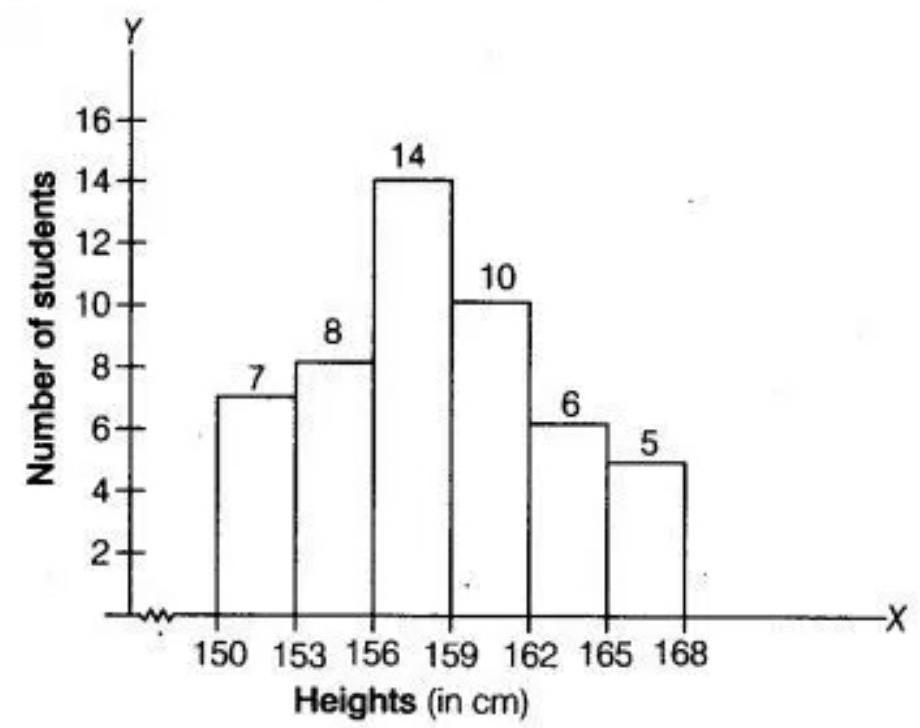
3. Draw a histogram of the following distribution:
| Heights (in cm) | Number of students |
|---|---|
| $150-153$ | 7 |
| $153-156$ | 8 |
| $156-159$ | 14 |
| $159-162$ | 10 |
| $162-165$ | 6 |
| $165-168$ | 5 |
Show Answer
Solution
Histogram which represents the given frequency distribution is shown below:
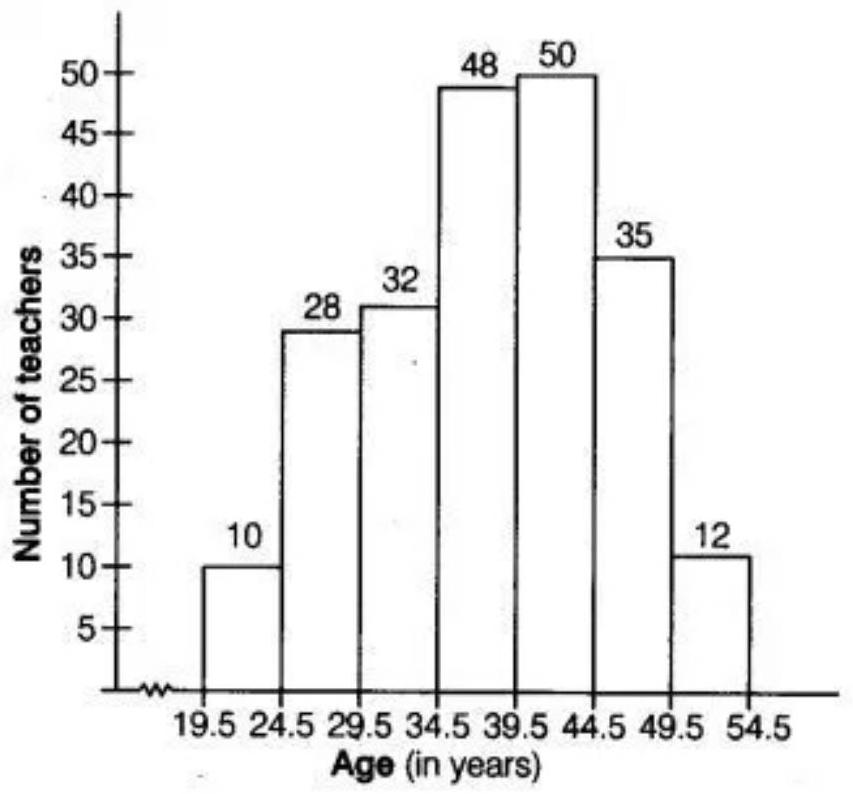
4. Draw a histogram to represent the following grouped frequency distribution:
| Ages (in years) | Number of teachers |
|---|---|
| $20-24$ | 10 |
| $25-29$ | 28 |
| $30-34$ | 32 |
| $35-39$ | 48 |
| $40-44$ | 50 |
| $45-49$ | 35 |
| $50-54$ | 12 |
Show Answer
Solution
The given table is in exclusive form. So, first convert it into an exclusive form, as given below:
| Age (in years) | Number of teachers |
|---|---|
| $19.5-24.5$ | 10 |
| $24.5-29.5$ | 28 |
| $29.5-34.5$ | 32 |
| $34.5-39.5$ | 48 |
| $39.5-44.5$ | 50 |
| $44.5-49.5$ | 35 |
| $49.5-54.5$ | 12 |
A histogram for this table is shown in the figure given below:
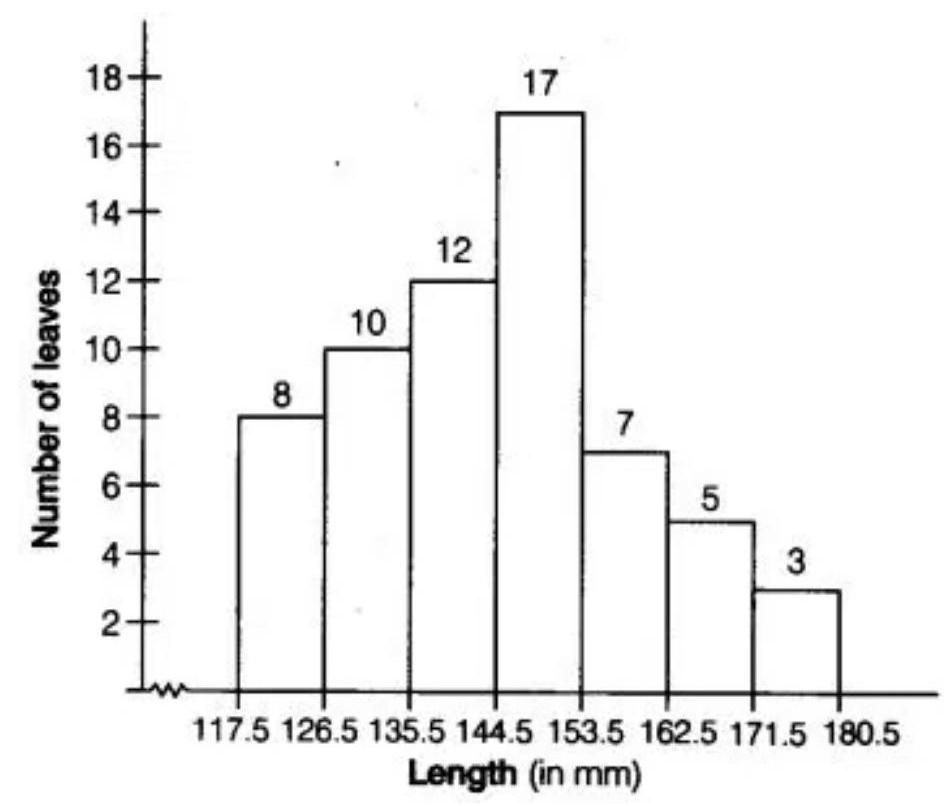
5. The lengths of 62 leaves of a plant are measured in millimetres and the data is represented in the following table:
| Length (in $\mathbf{~ m m}$ ) | Number of leaves |
|---|---|
| $118-126$ | 8 |
| $127-135$ | 10 |
| $136-144$ | 12 |
| $145-153$ | 17 |
| $154-162$ | 7 |
| $163-171$ | 5 |
| $172-180$ | 3 |
Draw a histogram to represent the data above.
Show Answer
Solution
The given table is in exclusive form. So, first convert it into an exclusive form, as given below:
| Length (in mm) | Number of leaves |
|---|---|
| $117.5-126.5$ | 8 |
| $126.5-135.5$ | 10 |
| $135.5-144.5$ | 12 |
| $144.5-153.5$ | 17 |
| $153.5-162.5$ | 7 |
| $162.5-171.5$ | 5 |
| $171.5-180.5$ | 3 |
A histogram for this table is shown in the figure given below:
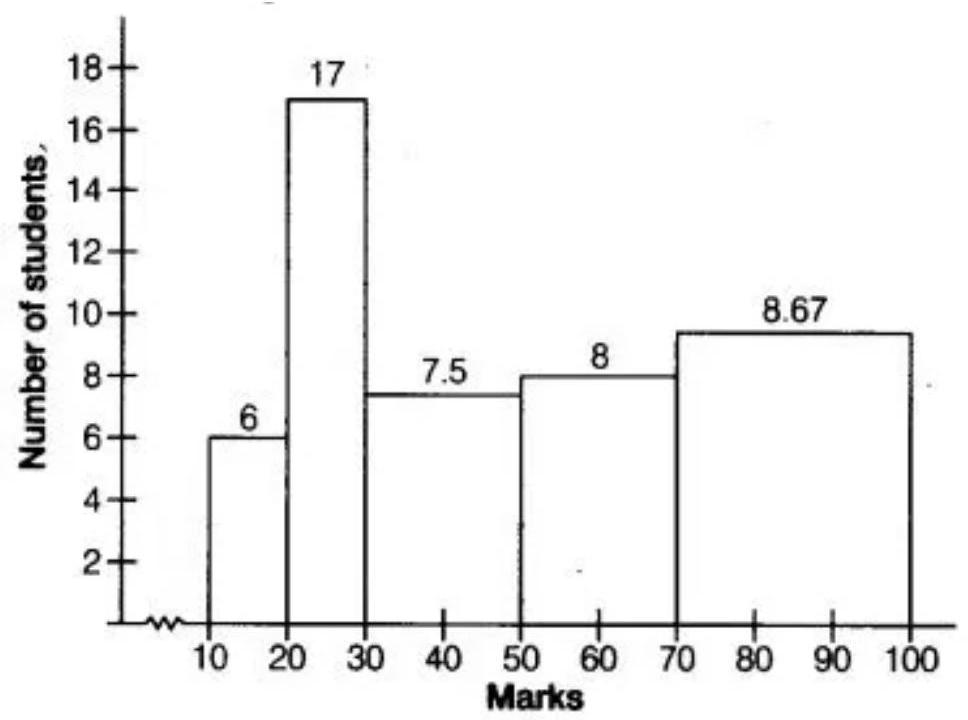
6. The marks obtained (out of 100) by a class of 80 students are given below:
| Marks | Number of students |
|---|---|
| $10-20$ | 6 |
| $20-30$ | 17 |
| $30-50$ | 15 |
| $50-70$ | 16 |
| $70-100$ | 26 |
Construct a histogram to represent the data above.
Show Answer
Solution
See the given table, the class intervals are of unequal width. So, we calculate the adjusted frequency for each class.
Now, minimum size $=20-10=10$
The formula of adjusted frequencies are:
Adjusted frequency $=\dfrac{\text{ Minimum class }- \text{ size }}{\text{ Class }- \text{ size }} \times$ Frequency of the class
Now, the modified table for frequency distribution is given by:
| Marks | Number of students (Frequency) |
Adjusted frequency |
|---|---|---|
| $10-20$ | 6 | $\dfrac{10}{10} \times 6=6$ |
| $20-30$ | 17 | $\dfrac{10}{10} \times 17=17$ |
| $30-50$ | 15 | $\dfrac{10}{20} \times 15=\dfrac{15}{2}=7.5$ |
| $50-70$ | 16 | $\dfrac{10}{20} \times 16=\dfrac{16}{2}=8$ |
| $70-100$ | 26 | $\dfrac{10}{30} \times 26=\dfrac{26}{3}=8.67$ |
Now, let’s construct rectangles with class-limits as base and respective adjusted frequencies as heights.
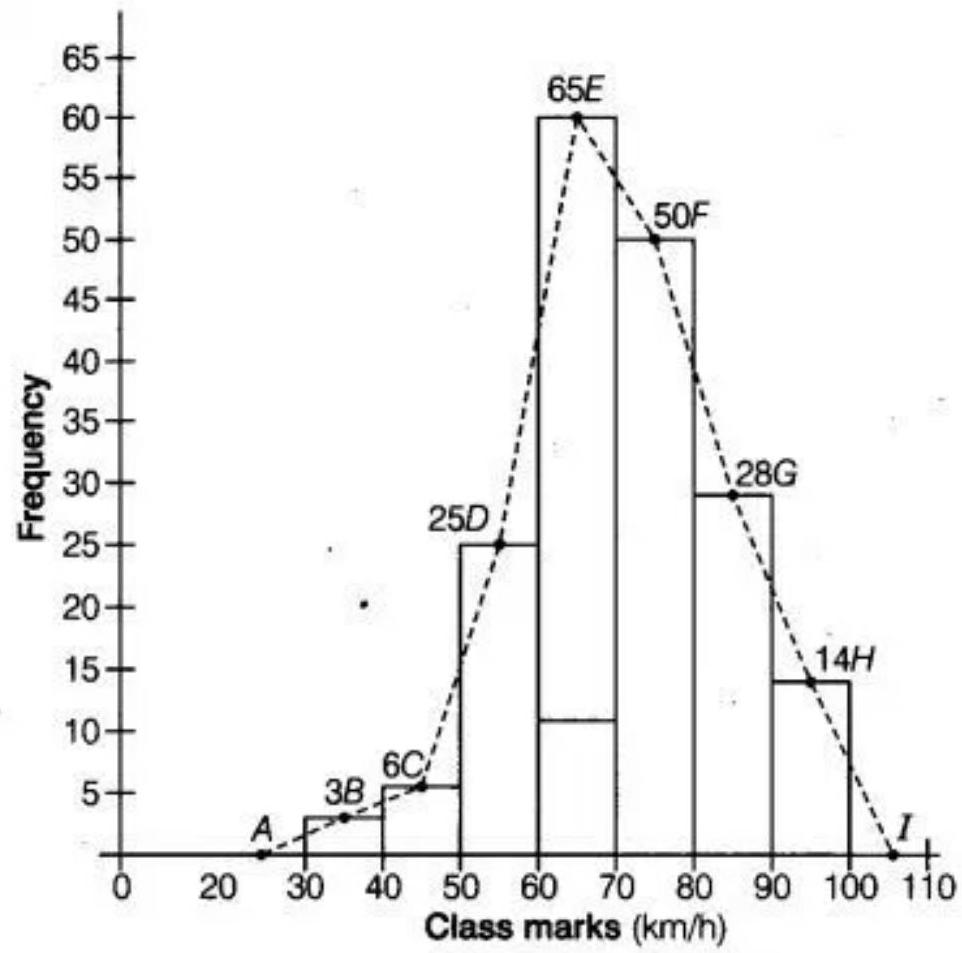
7. Following table shows a frequency distribution for the speed of cars passing through at a particular spot on a high way:
| Class interval $(km / h)$ | Frequency |
|---|---|
| $30-40$ | 3 |
| $40-50$ | 6 |
| $50-60$ | 25 |
| $60-70$ | 65 |
| $70-80$ | 50 |
| $80-90$ | 28 |
| $90-100$ | 14 |
Draw a histogram and frequency polygon representing the data above.
Show Answer
Solution
In the given figure below, a histogram and a frequency polygon are drawn on the same scale. The class interval has represented on the $x$-axis and the frequency has represented on the $y$ axis.
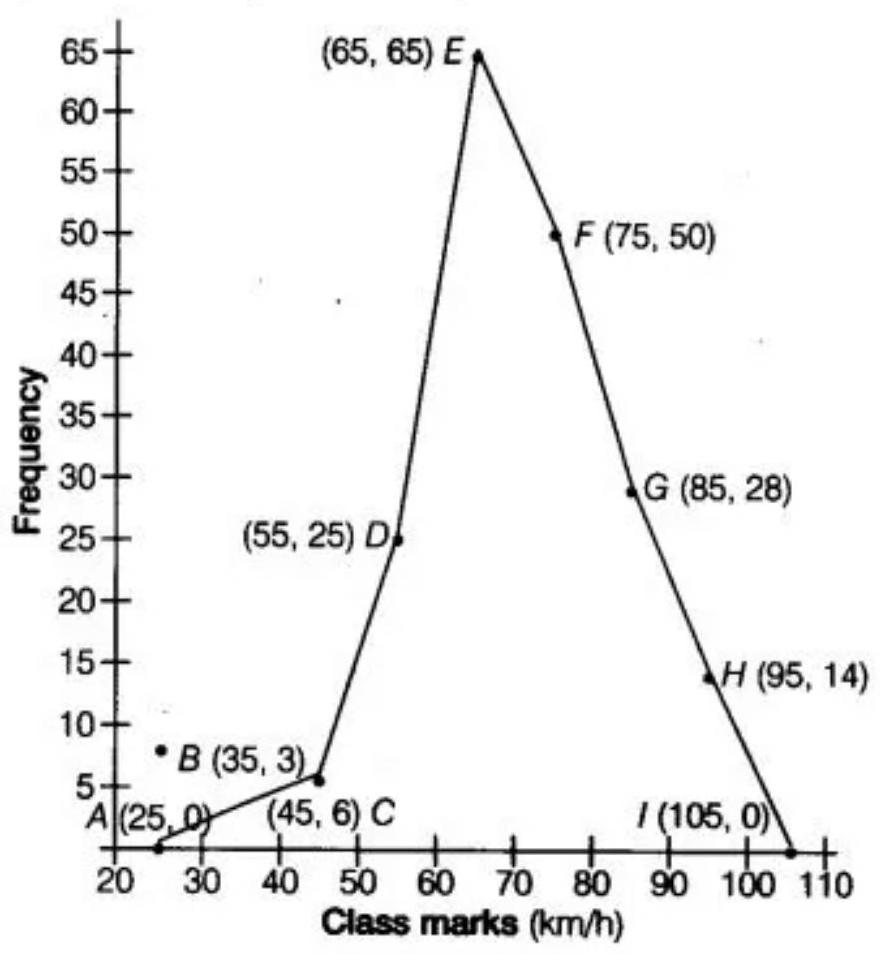
8. Refer to Q. 7 :
Draw the frequency polygon representing the above data without drawing the histogram.
Show Answer
Solution
First we obtain in the class marks (mid-marks) of the given table as:
Class-marks $=\dfrac{\text{ Lower limit }+ \text{ Upper limit }}{2}$
Since, the new table is shown below:
| Class interval $(\mathbf{k m} / \mathbf{h})$ |
Class marks | Frequency |
|---|---|---|
| $30-40$ | 35 | 3 |
| $40-50$ | 45 | 6 |
| $50-60$ | 55 | 25 |
| $60-70$ | 65 | 65 |
| $70-80$ | 75 | 50 |
| $80-90$ | 85 | 28 |
| $90-100$ | 95 | 14 |
Now, let’s draw a frequency polygon by plotting the class marks along the $x$ - axis and the frequency along $y$-axis.
Also, plotting all the points as $B(35,3), C(45,6), D(55,25), E(65,65), F(75,50), G(85,28)$ and $H(95,14)$. Then, join all these point line segment, shown below:
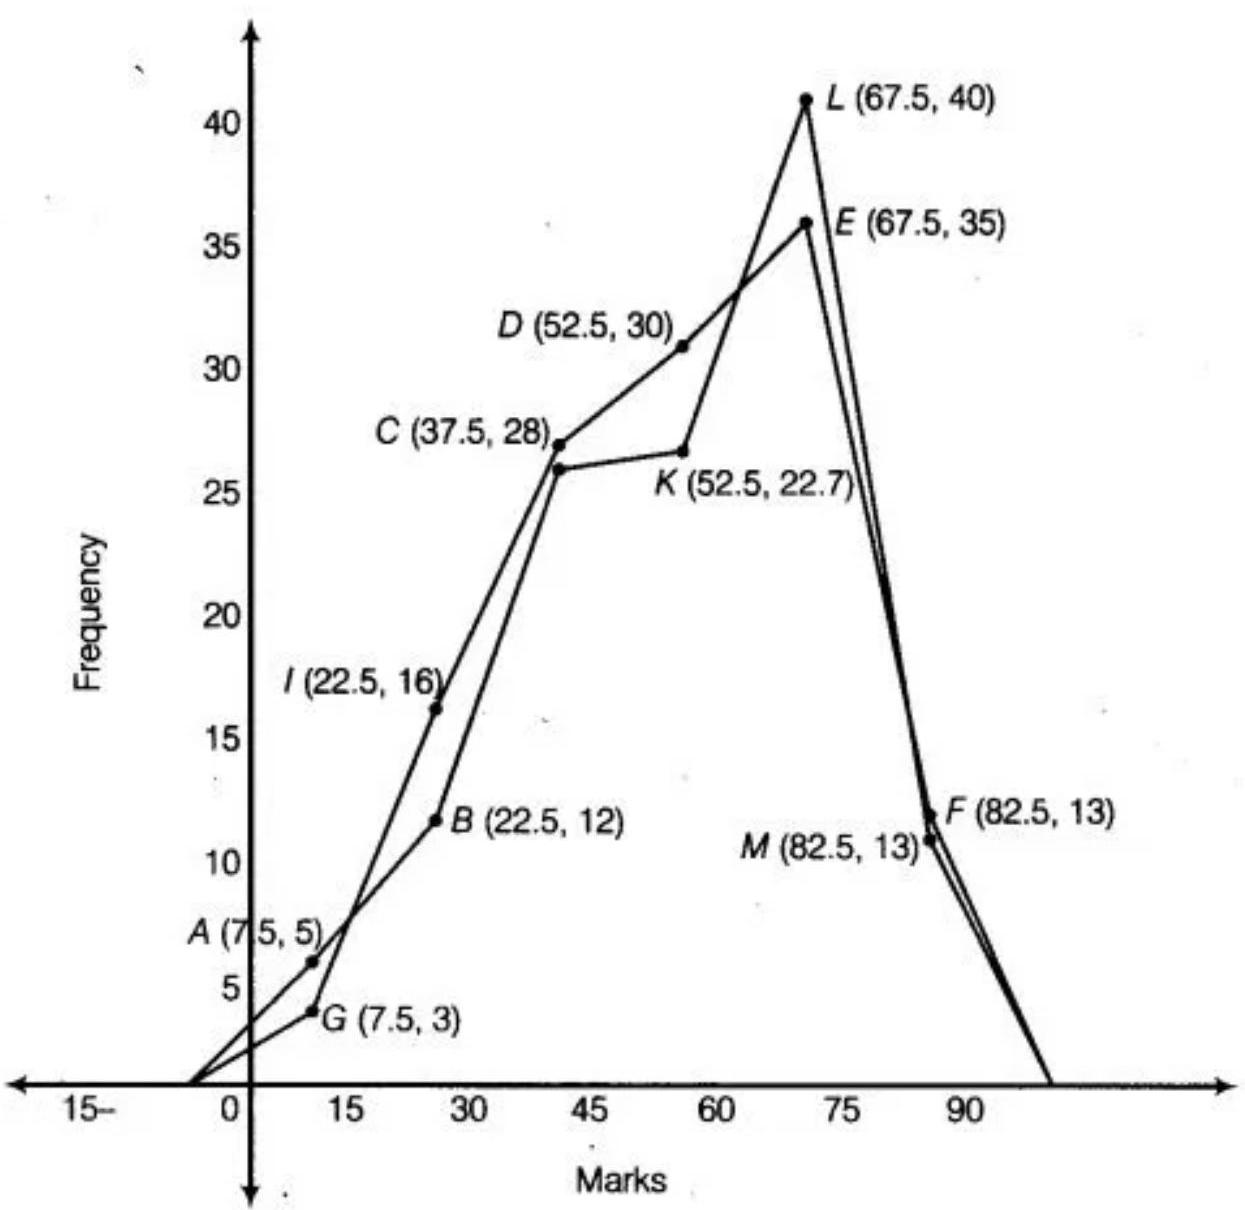
9. Following table gives the distribution of students of sections $A$ and $B$ of a class according to the marks obtained by them.
| Section A | Section B | ||
|---|---|---|---|
| Marks | Frequency | Marks | Frequency |
| $\mathbf{0 - 1 5}$ | $\mathbf{5}$ | $\mathbf{0 - 1 5}$ | $\mathbf{3}$ |
| $\mathbf{1 5 - 3 0}$ | $\mathbf{1 2}$ | $\mathbf{1 5 - 3 0}$ | $\mathbf{1 6}$ |
| $\mathbf{3 0 - 4 5}$ | $\mathbf{2 8}$ | $\mathbf{3 0 - 4 5}$ | $\mathbf{2 5}$ |
| $\mathbf{4 5 - 6 0}$ | $\mathbf{3 0}$ | $\mathbf{4 5 - 6 0}$ | $\mathbf{2 7}$ |
| $\mathbf{6 0 - 7 5}$ | $\mathbf{3 5}$ | $\mathbf{6 0 - 7 5}$ | $\mathbf{4 0}$ |
| $\mathbf{7 5 - 9 0}$ | $\mathbf{1 3}$ | $\mathbf{7 5 - 9 0}$ | $\mathbf{1 0}$ |
Represent the marks of the students of both the sections on the same graph by two frequency polygons. What do you observe?
Show Answer
Solution
First we obtain in the mid-marks of the given section A and B as:
Mid-marks $=\dfrac{\text{ Lower limit }+ \text{ Upper limit }}{2}$
Since, the new table for section A and B is shown below:
| Section A | Section B | ||||
|---|---|---|---|---|---|
| Marks | Mid marks |
Frequency | Marks | Mid marks |
Frequency |
| $0-15$ | 7.5 | 5 | $0-15$ | 7.5 | 3 |
| $15-30$ | 22.5 | 12 | $15-30$ | 22.5 | 16 |
| $30-45$ | 37.5 | 28 | $30-45$ | 37.5 | 25 |
| $45-60$ | 52.5 | 30 | $45-60$ | 52.5 | 27 |
| $60-75$ | 67.5 | 35 | $60-75$ | 67.5 | 40 |
| $75-90$ | 82.5 | 13 | $75-90$ | 82.5 | 10 |
Now, we represent the mid-marks on $x$-axis and the frequency on $y$-axis. So, plotting all the points for section $A$ as:
$A(7.5,5), B(22.5,12), C(37.5,28), D(52.5,30), E(67.5,35), F(82.5,13)$
Similarly, plotting all the points for section $B$ as:
$H(7.5,5), I(22.5,12), J(37.5,25), K(52.5,27), L(67.5,40), M(82.5,10)$
Now, the two frequency polygon are shown in the figure given below:
10. The mean of the following distribution is 50.
| $x$ | $f$ |
|---|---|
| $\mathbf{1 0}$ | 17 |
| $\mathbf{3 0}$ | $5 a+3$ |
| $\mathbf{7 0}$ | 32 |
| $\mathbf{9 0}$ | $7 a-11$ |
Find the value of $a$ and hence the frequencies of 30 and 70.
Show Answer
Solution
The formula of the mean $(\bar{{}x})$ is:
$\bar{{}x}=\dfrac{\sum _{i=1}^{n} f_i x_i}{\sum _{i=1}^{n} f_i}$
So, the value of a will be calculated as follows:
$ \begin{aligned} 50 & =\dfrac{17 \times 10+(5 a+3) \times 30+32 \times 50+(7 a-11) \times 70+19 \times 90}{17+5 a+3+32+7 a-11+19} \\ 50 & =\dfrac{170+150 a+90+1600+490 a-770+1710}{12 a+60} \\ 50 & =\dfrac{3570-770+640 a}{12 a+60} \\ 2800+640 a & =600 a+3000 \\ 40 a & =200 \\ a & =5 \end{aligned} $
So, frequency of 30 will be $=5 a+3=5 \times 5+3=25+3=28$
Similarly, frequency of 70 will be $=7 a-11=7 \times 5-11=35-11=24$
Therefore, the frequency of 30 and 70 are 28 and 24 respectively.
11. The mean marks (out of 100) of boys and girls in an examination are 70 and 73 , respectively. If the mean marks of all the students in that examination is 71 , find the ratio of the number of boys to the number of girls.
Show Answer
Solution
Let the number of boys be $n_1$ and number of girls be $n_2$.
According to the question,
Mean marks of boys $(\bar{x}_1)=70$
Mean marks of girls $(\bar{x}_1)=73$
The formula of mean $(\bar{{}x})$ will be:
Let the number of boys be $n_1$ and number of girls be $n_2$.
Using $ \bar{x}=\dfrac{n_1 \bar{x}_1+n_2 \bar{x}_2}{n_1+n_2} $
where $\bar{x}_1=70, \bar{x}_2=73$ and $\bar{x}_3=71$.
$ \begin{array}{rlrl} 71 =\dfrac{n_1 \times 70+n_2 \times 73}{n_1+n_2} \\ \Rightarrow 71 n_1+71 n_2 =70 n_1+73 n_2 \\ \Rightarrow n_1 =2 n_2 \\ \Rightarrow \dfrac{n_1}{n_2} =\dfrac{2}{1} \end{array} $
Hence, the ratio of the number of boys to the number of girls is $2: 1$.


