Simple Harmonic Motion 1 Question 4
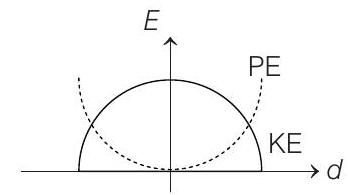
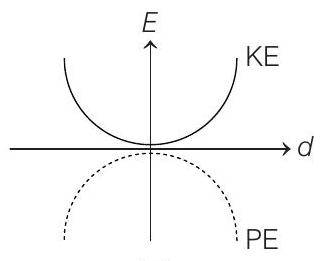
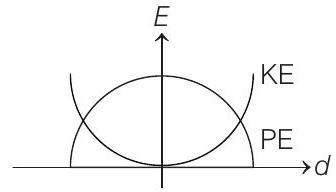
4. For a simple pendulum, a graph is plotted between its Kinetic Energy (KE) and Potential Energy (PE) against its displacement
(2015 Main)
(a)
(c)
(b)
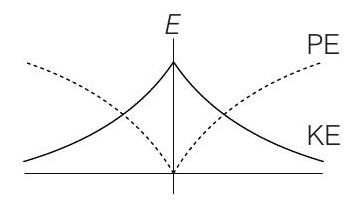
(d)
Show Answer
Answer:
Correct Answer: 4. (a)
Solution:
- Taking minimum potential energy at mean position to be zero, the expression of
Both graphs are parabola. At
At
Therefore, the correct graph is (a).


