Heat and Thermodynamics 6 Question 9
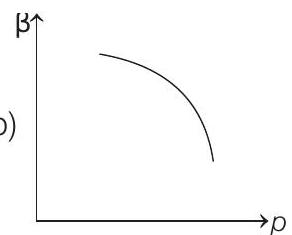
13. Which of the following graphs correctly represent the variation of
(a)

(b)
(c)

(d)

Show Answer
Answer:
Correct Answer: 13. (a)
Solution:
and
Thus,


