Heat and Thermodynamics 3 Question 14
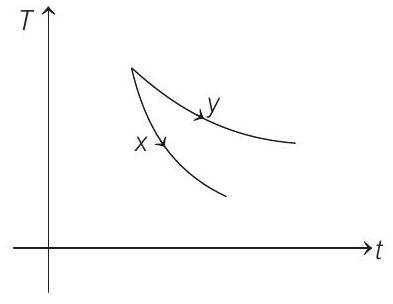
14. The graph, shown in the diagram, represents the variation of temperature $(T)$ of the bodies, $x$ and $y$ having same surface area, with time $(t)$ due to the emission of radiation. Find the correct relation between the emissivity and absorptivity power of the two bodies
(2003, 2M)

(a) $E _x>E _y$ and $a _x<a _y$
(b) $E _x<E _y$ and $a _x>a _y$
(c) $E _x>E _y$ and $a _x>a _y$
(d) $E _x<E _y$ and $a _x<a _y$
Show Answer
Answer:
Correct Answer: 14. (c)
Solution:
- Rate of cooling $\left(-\frac{d T}{d t}\right) \propto \operatorname{emissivity}(e)$
From the graph,
$$ \begin{aligned} & \left(-\frac{d T}{d t}\right) _x & >\left(-\frac{d T}{d t}\right) _y \\ \therefore \quad & E _x & >E _y \end{aligned} $$
Further emissivity $(E)=$ absorptive power $(a)$ (good absorbers are good emitters also)
$$ \therefore \quad a _x>a _y $$


