Kinematics 4 Question 5
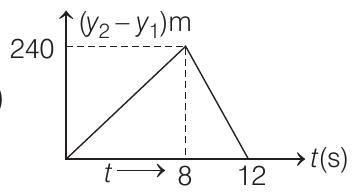
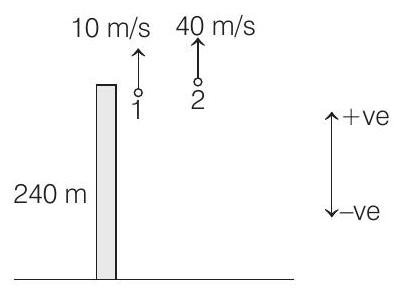
5. Two stones are thrown up simultaneously from the edge of a cliff
(2015 Main) (a)
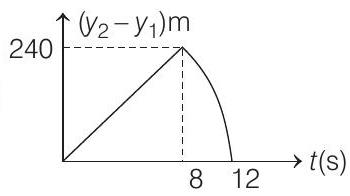
(c)
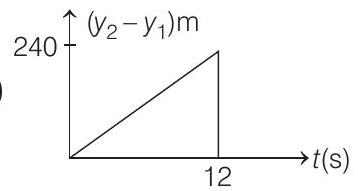
(b)
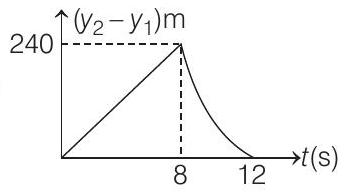
(d)
Show Answer
Solution:
Let us first find, time of collision of two particles with ground in putting proper values in the equation
Solving, we get the position value of
Therefore, the first particle will strike the ground at
Similarly,
Solving this equation, we get positive value of
If
from 0 to
or
Similarly,
At
From
Therefore,


