Current Electricity 1 Question 3
3. In an experiment, the resistance of a material is plotted as a function of temperature (in some range). As shown in the figure, it is a straight line.
(2019 Main, 10 April I)
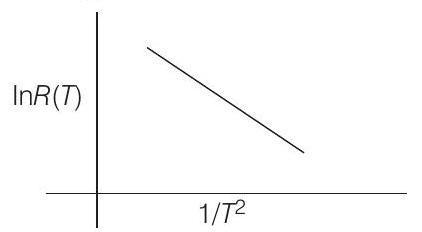
One may conclude that
(a)
(b)
(c)
(d)
Show Answer
Solution:
- From the given graph,
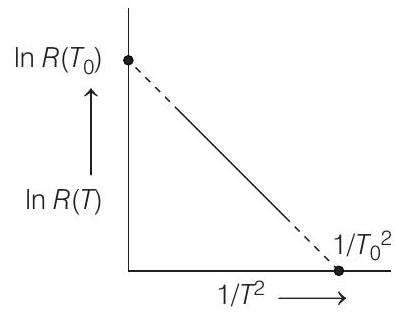
We can say that,
Negative sign implies that the slope of the graph is negative.
Alternate Solution
From graph,
or


