Question: Q. 2. Draw a graph showing the variation of de- Broglie wavelength
A [Delhi Comptt. II 2017]
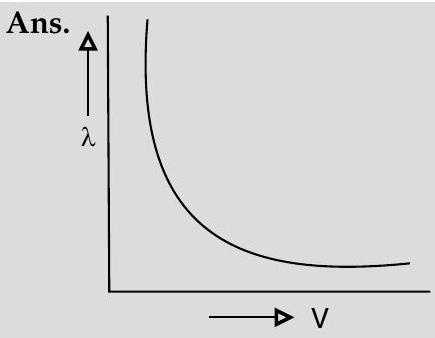
de-Broglie wavelength,
Since,
$$ \begin{array}{rlrl} & \therefore & \sqrt{2 m_{p}(K){p}} & =\sqrt{2 m{\alpha}(K){\alpha}} \ \Rightarrow & m{p}(K){p} & =m{\alpha}(K){\alpha} \ \text { as } & m{\alpha} & >m_{p} \ \Rightarrow & K . E_{p} & >\text { K.E. }_{\alpha} \end{array} $$
Q.3. (i) Describe briefly how Davisson-Germer experiment demonstrated the wave nature of electrons.
(ii) An electron is accelerated from rest through a potential V. Obtain the expression for the de-Broglie wavelength associated with it. U] [Foreign 2014]
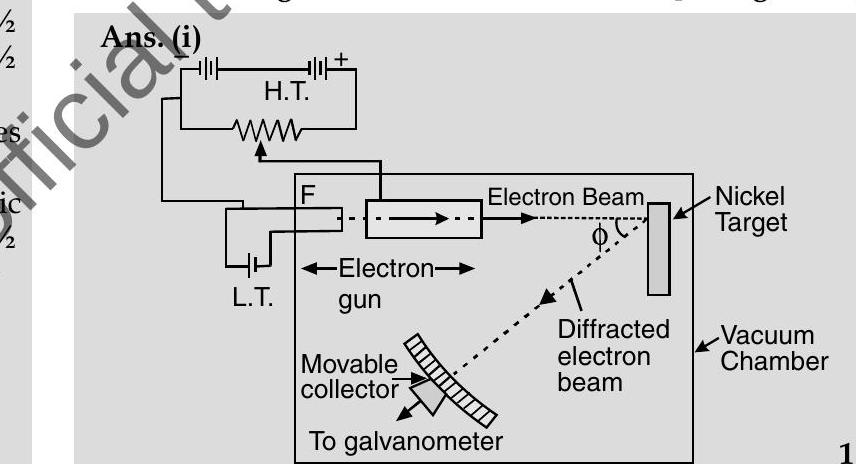
This experiment confirms the wave nature of electron.
(ii)

[CBSE Marking Scheme 2014]
Detailed Answer :
(i) Davisson-Germer Experiment Setup :
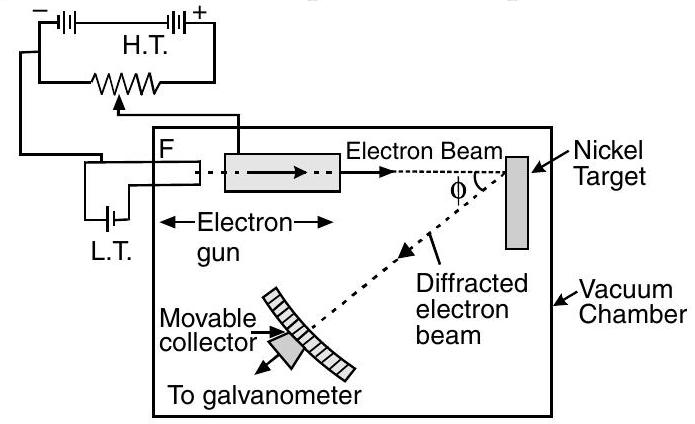 (a) They used electron gun for firing electrons on Nickel metal.
(b) Electrons were accelerated to desired potential
(c) Interatomic space of Nickel acts as slit for diffracting electron waves.
(d) To avoid collisions of the electrons with other molecules on their way towards the surface, the experiment was conducted in a vacuum chamber.
(e) The intensity of scattered electrons was detected by electronic movable detector.
(f) The detector could move on a circular scale and was connected to a galvanometer.
(g) They plotted the radial graph with different scattered angles
(h) Experimental reading showed a strong intensity peak
(i) By this they demonstrated the wave nature of electrons.
(ii) de-Broglie wavelength of matter
Kinetic energy,
putting this expression of momentum
If an electron accelerated with electric potential
Putting this value of kinetic energy in eq. (ii)
This is the desired expression.
Q. 4. The data given below gives the photon energy (in
| Wavelength (in nm) |
200 | 400 | 600 | 800 | 1000 | 1200 |
|---|---|---|---|---|---|---|
| Photon energy (in eV) |
6.216 | 3.108 | 2.072 | 1.554 | 1.243 | 1.036 |
(Without doing any calculation/taking any reading), explain how one can use this data to draw an appropriate graph to infer
(i) photon energy corresponding to a wavelength of
(ii) the wavelength value (in
(iii) velocity of light, assuming that the value of Planck’s constant is known.
A [SQP 2014]
Show Answer
Solution:
Ans. One can calculate the values of
1
The resulting straight line graph can be used to :
(i) read the value of
(ii) read the value of
(iii) We have
The slope of the graph (after appropriate adjustment of the units) would equal
[CBSE Marking Scheme 2014]


